Reversing malicious Windows executables involves examining static properties, identifying suspicious strings and API calls, performing behavior analysis, and using disassemblers and debuggers. You'll also find registers, common assembly instructions, and risky API calls for code injection, process hollowing, and anti-analysis.
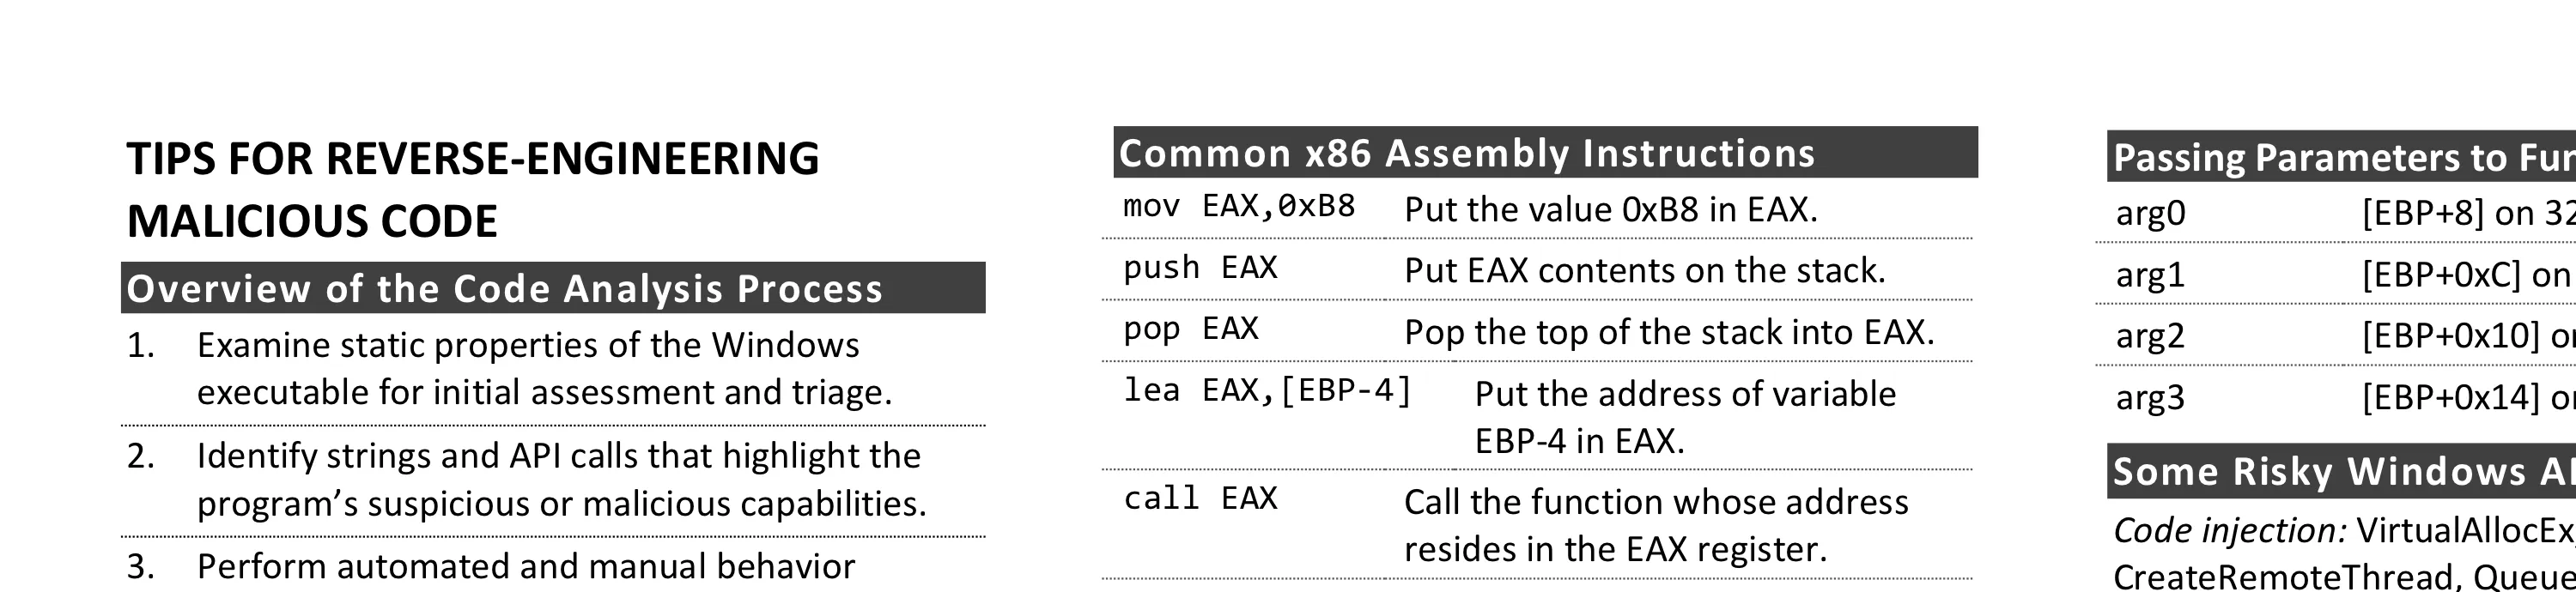
This cheat sheet outlines tips for reversing malicious Windows executables via static and dynamic code analysis with the help of a debugger and a disassembler. To print it, use the one-page PDF version. You can also edit the Word version to customize it for your own needs.
Overview of the Code Analysis Process
- Examine static properties of the Windows executable for initial assessment and triage.
- Identify strings and API calls that highlight the program’s suspicious or malicious capabilities.
- Perform automated and manual behavior analysis to gather additional details.
- Emulate code execution with tools such as Speakeasy to find areas for further analysis.
- Use a disassembler and decompiler to statically examine code related to risky strings and APIs.
- Use a debugger for dynamic analysis to examine how risky strings and API calls are used.
- If appropriate, unpack the code and its artifacts.
- As your understanding of the code increases, add comments, labels; rename functions, variables.
- Progress to examine the code that references or depends upon the code you’ve already analyzed.
- Repeat steps 5-9 above as necessary (the order may vary) until your analysis objectives are met.
Common 32-Bit Registers and Uses
| Register |
Use |
| EAX |
Addition, multiplication, function results |
| ECX |
Counter; used by LOOP and others |
| EBP |
Frame pointer for referencing arguments (EBP+offset) and locals (EBP-offset) |
| ESP |
Points to the current “top” of the stack; changes via PUSH, POP, and others |
| ESI/EDI |
Source and destination for string copies |
| EIP |
Instruction pointer; points to the next instruction; shellcode gets it via call/pop |
| EFLAGS |
Contains flags that store outcomes of computations (e.g., Zero and Carry flags) |
| FS |
Locates the TEB: FS:[0] points to the SEH chain, FS:[0x30] to the PEB. |
Common x86 Assembly Instructions
| Instruction |
Description |
mov EAX,0xB8 |
Put the value 0xB8 in EAX. |
push EAX |
Put EAX contents on the stack. |
pop EAX |
Pop the top of the stack into EAX. |
lea EAX,[EBP-4] |
Put the address of variable EBP-4 in EAX. |
call EAX |
Call the function whose address resides in the EAX register. |
leave |
MOV ESP,EBP then POP EBP. |
ret |
Pop the return address into EIP. |
add ESP,8 |
Increase ESP by 8 to shrink the stack by two 4-byte arguments. |
sub ESP,0x54 |
Make room for local variables. |
xor EAX,EAX |
Set EAX contents to zero. |
test EAX,EAX |
Check whether EAX contains zero, set the appropriate EFLAGS bits. |
cmp EAX,0xB8 |
Compare EAX to 0xB8, set the appropriate EFLAGS bits. |
Understanding 64-Bit Registers
- EAX→RAX, ECX→RCX, EBX→RBX, ESP→RSP, EIP→RIP
- Additional 64-bit registers are R8-R15.
- In 64-bit processes, GS:[0x60] points to the PEB.
- Stack data is often accessed via RSP, not RBP.
|||||||||||||||||||||||||||||||||||||||||||||||||||||||||||||||| R8 (64 bits)
________________________________|||||||||||||||||||||||||||||||| R8D (32 bits)
________________________________________________|||||||||||||||| R8W (16 bits)
________________________________________________________|||||||| R8B (8 bits)
Decoding Conditional Jumps
| Instruction |
Description |
JA / JG |
Jump if above/jump if greater. |
JB / JL |
Jump if below/jump if less. |
JE / JZ |
Jump if equal; same as jump if zero. |
JNE / JNZ |
Jump if not equal; same as not zero. |
JGE / JNL |
Jump if greater or equal (not less). |
JLE / JNG |
Jump if less or equal (not greater). |
Passing Parameters to Functions on Windows
| Argument |
Location |
| arg0 |
[EBP+8] on 32-bit, RCX on 64-bit |
| arg1 |
[EBP+0xC] on 32-bit, RDX on 64-bit |
| arg2 |
[EBP+0x10] on 32-bit, R8 on 64-bit |
| arg3 |
[EBP+0x14] on 32-bit, R9 on 64-bit |
Some Risky Windows API Calls
- Code injection: VirtualAllocEx, WriteProcessMemory, CreateRemoteThread, QueueUserAPC
- Process hollowing: CreateProcess, NtUnmapViewOfSection, SetThreadContext
- Dynamic API resolution: LoadLibrary, GetProcAddress
- Data theft: CryptUnprotectData, GetClipboardData, GetAsyncKeyState, SetWindowsHookEx
- Anti-analysis: IsDebuggerPresent, CheckRemoteDebuggerPresent, GetTickCount, GlobalMemoryStatusEx
- Embedded resources: FindResource, LockResource
- Unpacking/self-injection: VirtualAlloc, VirtualProtect
- Query artifacts: CreateMutex, RegOpenKeyEx
- Execute a program: CreateProcess, ShellExecute
- Web interactions: InternetOpen, HttpSendRequest, InternetReadFile, WinHttpOpenRequest
Additional Code Analysis Tips
- Look at jumps and calls to assess how the sample flows from one “interesting” code block to another.
- TRACE each artifact: Target it, pull References, Analyze the caller, Contextualize, Explain.
- Ask an AI agent to explain a function or check your theory, then confirm the answer in the code.
- If code analysis takes too long, consider whether behavior or memory analysis will meet your goals.
- When looking for API calls, know the official API names and the associated native APIs (Nt, Zw, Rtl).
- For .NET samples, decompile with ILSpy or dnSpyEx, and try de4dot to deobfuscate.
Thanks to Anuj Soni for feedback and to Ryan Chapman for the idea behind the TRACE acronym. This cheat sheet is distributed under the Creative Commons Attribution 4.0 International License.
About the Author
Lenny Zeltser is a cybersecurity executive with deep technical roots, product management experience, and a business mindset. He has built security products and programs from early stage to enterprise scale. He is also a Faculty Fellow at SANS Institute and the creator of REMnux, a popular Linux toolkit for malware analysis. Lenny shares his perspectives on security leadership and technology at zeltser.com.