Malware analysis combines behavior analysis with static and dynamic code analysis to understand malicious software. Key steps include triaging with an AI agent or sandbox, monitoring system and network interactions, examining code with Ghidra and x64dbg, and unpacking protected samples.

This cheat sheet presents tips for analyzing and reverse-engineering malware. It outlines the steps for performing behavior and code-level analysis of malicious software. To print it, use the one-page PDF version. You can also edit the Word version to customize it for your own needs.
Overview of the Malware Analysis Process
- Set up a controlled, isolated lab in which to examine the malware sample.
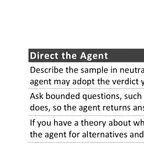
- Use an AI agent or automated sandbox to triage the sample, treating its findings as theories.
- Examine static properties and metadata of the sample for early theories.
- Emulate the sample’s code with tools such as Speakeasy to identify capabilities.
- Perform behavior analysis to examine the sample’s interactions with its environment.
- Analyze relevant aspects of the code statically with a disassembler and decompiler.
- Perform dynamic code analysis in a debugger such as x64dbg to further explore the sample.
- If necessary, unpack the sample.
- Repeat steps 4-8 above as necessary (the order may vary) until your analysis objectives are met.
- Augment your analysis using other methods, such as memory forensics and threat intel.
- Document findings, save analysis artifacts and clean up the lab for future analysis work.
Behavior Analysis
- Be ready to revert to a good state via virtualization snapshots, Clonezilla, dd, FOG, etc.
- Monitor local interactions: System Informer, Process Monitor, ProcDOT, Noriben.
- Detect significant local changes: Regshot, Autoruns.
- Monitor network interactions: Wireshark, Fiddler, TShark, NetworkMiner, PolarProxy.
- Redirect network traffic: fakedns, accept-all-ips.
- Activate services the malware requests, then reinfect the system: INetSim, Netcat, or actual services.
- Adjust the runtime environment for the sample as it requests additional local or network resources.
Ghidra for Static Code Analysis
| Action | Shortcut |
|---|---|
| Go to specific destination | g |
| Show references to instruction | Ctrl+Shift+f |
| Insert a comment | ; |
| Follow jump or call | Enter |
| Go to previous/next location | Alt+Left / Alt+Right |
| Define data type | t |
| Add a bookmark | Ctrl+d |
| Text search | Ctrl+Shift+e |
| Add or edit a label | l |
| Disassemble values | d |
x64dbg/x32dbg for Dynamic Code Analysis
| Action | Shortcut |
|---|---|
| Run the code | F9 |
| Restart the program | Ctrl+F2 |
| Step into/over instruction | F7 / F8 |
| Execute until selected instruction | F4 |
| Execute until the function returns | Ctrl+F9 |
| Run to user code | Alt+F9 |
| Go to current instruction | * |
| Go to specific expression | Ctrl+g |
| Insert comment / label | ; / : |
| Show current function as a graph | g |
| Toggle breakpoint | F2 |
| Set breakpoint on API | Command: SetBPX API |
| Set hardware execution breakpoint | Command: bph address |
| Assemble instruction | Spacebar |
| Edit data or opcode | Ctrl+e |
| Extract API call references | Right-click in disassembly » Search for » Current module » Intermodular calls |
Unpacking Malicious Code
- Check for packing with Detect It Easy, Exeinfo PE, Bytehist, peframe, pecheck, etc.
- To try unpacking the sample quickly, infect the lab system and dump from memory using Scylla.
- For more precision, find the Original Entry Point (OEP) in a debugger and dump with OllyDumpEx.
- To seek the OEP, set a memory execute breakpoint on the region where the unpacker writes its code.
- Once a region from VirtualAlloc holds a PE, save it via Memory Map » Dump Memory to File.
- Carve embedded PE files using pecheck.
- Break on VirtualAllocEx, WriteProcessMemory, or QueueUserAPC to catch injection.
- If you can’t dump cleanly, examine the packed sample via dynamic code analysis while it runs.
- Rebuild the dump’s imports with Scylla: IAT Autosearch, Get Imports, Fix Dump.
Bypassing Other Analysis Defenses
- Decode obfuscated strings statically using FLOSS, xorsearch, Balbuzard, CyberChef, etc.
- Decode data in a debugger by setting a breakpoint after the decoding function and examining results.
- When imports look sparse, look for runtime API resolution via GetProcAddress or API name hashes.
- Conceal the debugger with ScyllaHide. In x32dbg, turn off Disable ASLR, which conflicts with it.
- Patch anti-analysis code, such as IsDebuggerPresent checks, in a debugger.
- Watch for unusual control flow via TLS callbacks, SEH, RET, CALL, etc. when stepping through code.
- Emulate shellcode with Speakeasy or scdbg, or run it in a debugger via runsc.
- For stable addresses, disable ASLR via x64dbg’s option, setdllcharacteristics, or CFF Explorer.
This cheat sheet is distributed under the Creative Commons Attribution 4.0 International License.